사용툴 및 세팅은 이전글 참고
[Pandas] 이동평균선 매매기법 뿌수기(with python) (tistory.com)
1. 코드
def Bollinger(df) :
index = df.index.astype('str')
ma20 = df['Close'].rolling(window = 20).mean()
bol_upper = ma20 + 2 * df['Close'].rolling(window = 20).std()
bol_down = ma20 - 2 * df['Close'].rolling(window = 20).std()
fig = plt.figure(figsize = (18,8))
ax_main = fig.add_subplot(1,1,1)
def x_date(x,pos):
try :
return index[int(x-0.5)][:7]
except IndexError :
return ''
ax_main.xaxis.set_major_locator(ticker.MaxNLocator(8))
ax_main.set_xlabel('Date', fontsize = 17)
plt.ylabel('Close Price', fontsize = 17)
ax_main.plot(index,ma20,label = 'MA20')
ax_main.plot(index,bol_upper,label = 'bol_upper')
ax_main.plot(index,bol_down,label = 'bol_down')
ax_main.set_title('Bollinger Band', fontsize = 23, position = (0.5,1.05))
plt.legend( loc='upper left', fontsize = 13)
candlestick2_ohlc(ax_main,df['Open'],df['High'],df['Low'],df['Close'], width = 0.5, colorup = 'orangered',colordown = 'deepskyblue')
plt.grid(b=True, color='DarkTurquoise', alpha=0.3, linestyle=':', linewidth=2)
plt.show()
Bollinger(df)
<핵심 코드>
index = df.index.astype('str')
ma20 = df['Close'].rolling(window = 20).mean()
bol_upper = ma20 + 2 * df['Close'].rolling(window = 20).std()
bol_down = ma20 - 2 * df['Close'].rolling(window = 20).std()
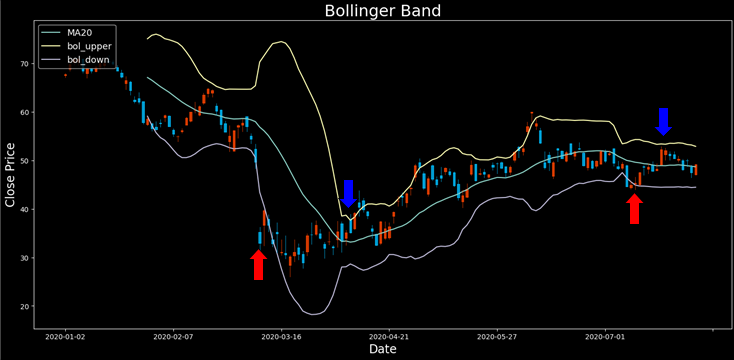
20 이동평균선을 기준으로 (+ 2*표준편차) & (- 2*표준편차) 의 값을 더하고 뺀 추이를 보여주는 그래프를 그림
<매매전략>
-> 볼린저 밴드 하단선을 깨고 하방을 가르킬때 -> 매수
볼린저밴드 상단선을 돌파하고 상방에 위치할때 -> 매도
2. 결과
HES 불린저밴드
1차 매수매도 수익률 : 18%
2차매수 매도 수익률 : 17%

MPC 불린저밴드
1차 매수매도 수익률 : 36%
2차매수 매도 수익률 : 22%

EOG 불린저밴드
1차 매수매도 수익률 : 43%
반응형
'기업 가치 분석 > 금융데이터 분석과 자동화(파이썬)' 카테고리의 다른 글
| F-Score / M-Score/ Z-Score를 기반으로 주가수익률 분석하기 (2) | 2023.12.05 |
|---|---|
| [Quant Trading Report] 에너지섹터 (HES/MPC/EOG) 투자보고서 (0) | 2023.11.15 |
| [pandas] RSI 기법 부수기 ( with python ) (0) | 2023.11.13 |
| [Pandas] 이동평균선 매매기법 뿌수기(with python) (2) | 2023.11.13 |
| Pair Trading 기법을 적용한 투자 포트폴리오(에너지 섹터)_ Quant trading with python/Excel (0) | 2023.11.07 |


